Forced Outage Modeling Using the Frequency Duration Method: Considerations, Pitfalls, and Solutions
Overview
Forced outage refers to a generator failure event, including the time required to complete the repair. Aurora accommodates several methods of modeling forced outages, including a deterministic derate method and a stochastic method. This article explores some modeling considerations with the use of the stochastic frequency duration method.
In Aurora, the user applies the frequency duration outage method by selecting Outage Method = Frequency Duration option in the Resource folder of Simulation Options. The parameters considered in the frequency duration method are those found in the following columns of the Resources Table (or – for the first three – in the Fuel Table): Forced Outage, Mean Repair Time, Risk Outage and Risk Resource Link (optional).
The value specified in the Forced Outage column is the expected forced outage rate (FOR) or the percent of hours in the course of a fixed time period (i.e., a year) that a unit is down on a forced outage. The value in the Mean Repair Time column is the mean time to repair (MTTR) or the average amount of time, in hours, that it would take to complete the repair after a unit has failed.
Mean Time To Failure
Aurora uses the FOR and MTTR values to obtain another value called the Mean Time to Failure or MTTF. The MTTF describes the mean or average elapsed time, in hours, between forced outage events.
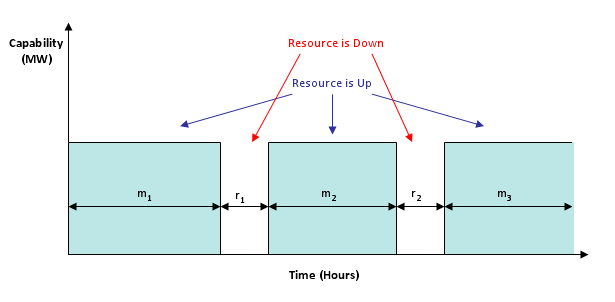
In the figure below,  is the random period of time during the year when a given unit is in operation.
 ![]() is the random period of time when the same unit is down for repair.
is the random period of time when the same unit is down for repair.
Figure 1. Resource Outage Figure

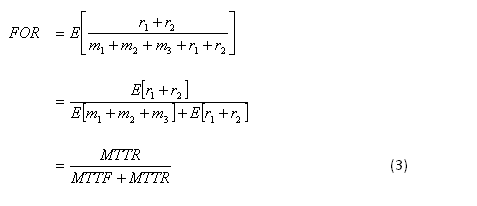
From the above figure, we observe the expected values as follows:

Using equations (1) and (2), we can now show that the expected forced outage rate is related to the MTTR and MTTF as follows:

By rearranging equation (3), we get the following equation, which Aurora uses to compute the MTTF based on the user specified expected FOR and MTTR.

There are a large number of combinations of values that can be specified for MTTR and FOR. As will be discussed below, however, certain combinations of MTTR and FOR will require increased sampling or specification of a longer study period in order to have the reported expected FOR closely approximate the input (i.e. assumed) FOR parameter.
The table below shows the resulting MTTF when the MTTR is assumed to be equal to 48 hours.
Table 1: MTTF resulting from a variety of FOR and a MTTR of 48 hours
|
FOR |
MTTR |
MTTF |
|
|
(% of time down on outage) |
(hours down once failed) |
(hours between failures) |
|
|
0.001% |
48 |
4,799,952 |
i.e., never fails |
|
1.0% |
48 |
4,752 |
i.e., once/6-7 months |
|
5.0% |
48 |
912 |
i.e., once/month |
|
10.0% |
48 |
432 |
|
|
15.0% |
48 |
272 |
|
|
20.0% |
48 |
192 |
i.e., once/week |
|
50.0% |
48 |
48 |
i.e., every two days |
|
65.0% |
48 |
25.8 |
i.e., every day |
|
99.0% |
48 |
0.5 |
i.e., always fails |
|
100.0% |
48 |
- |
i.e., always fails |
Introducing Uncertainty into the Formulation
Given a single parameter, namely the MTTF, and two states (operable and non-operable), Aurora introduces uncertainty into the formulation via the exponential distribution. The exponential distribution function is a single parameter distribution, with the mean consisting of the inverse of the MTTF (λ=1/MTTF). Its probability density function is given by:

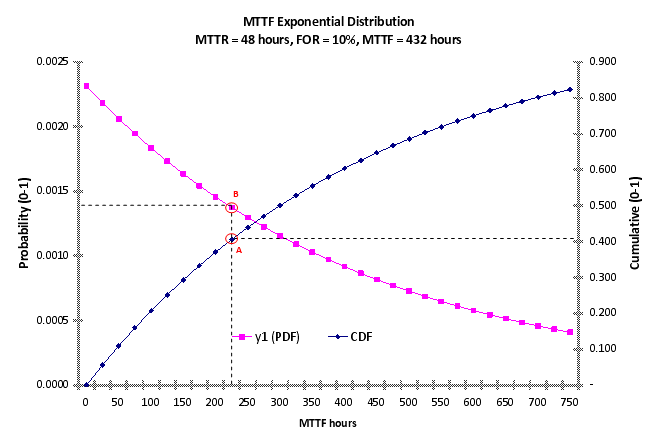
Figure 2 below illustrates the exponential cumulative distribution function (CDF) and probability density function (PDF) for the time to failure with MTTF=432 (FOR=10%, MTTR=48).
Figure 2: Exponential Distribution (MTTF=432)

The CDF in Figure 2 above is shown in blue is read from the right axis as the probability that the operating hours between outages will be less than or equal to the corresponding value on the horizontal or x-axis. For example, at point A, the probability that the continuous operating hours since the last outage will be less than or equal to 225 is 40.6.
The PDF on the other hand, is read from the left axis as the probability that the operating hours between outages will equal the value on the x-axis. Point B, which is consistent with Point A on the CDF, indicates that the probability of 225 continuous operating hours is 0.14 percent.
Together, the graphs illustrate: (1) the longer the operation of the unit, the more likely an outage event will occur; and (2) the higher the probability of an outage, the shorter the continuous operating hours.
Operating Hours or Elapsed Time?
The default method relies on unit operating hours when applying the MTTF parameter. The Freq Duration Outages Based on Elapsed Time option is selected in the Resources folder of Simulation Options. However, the method can be changed to rely on elapsed time. For base load units (i.e., units that operate in most hours), the choice of methods may not result in substantially different outcomes. However, with units that seldom operate (e.g., peakers), there may be substantial differences between the two methods.
|
Considerations when trying to match the observed average FOR to the input FOR parameter
|
Deciding on an Appropriate Number of Iterations
There are a variety of statistical and rule-of-thumb approaches that one can apply to decide the appropriate number of iterations. For example, one might consider some measure of convergence and a threshold below which convergence is assumed. Prices, as summary statistics, can be confidently used to measure convergence. Another possibility is to compare the average FOR statistics obtained from the output to the input FOR parameter for each unit.
Defining FORs on a Monthly Basis
Occasionally, you may have data that represents forced outage rates for particular units on a frequency more granular than annual (e.g., monthly). While Aurora allows for the input and consideration of such assumptions, we generally do not recommend inputting forced outage rates on less than an annual basis.
Additional precision in assumptions does not necessarily imply increased accuracy in results. More often than not, the assumptions may make it much more difficult to obtain a proper sampling, with a large increase in the required number of iterations as a partial remedy. In general, more granular FOR assumptions are feasible when mean repair time is very low (e.g., < 24 hrs) and the FOR is reasonably high (e.g., > 5%).
For example, referring to Table 1, for a FOR of 5 percent and a MTTR of 48 hours, the MTTF (i.e., the mean time between outage events) is 912 hours. Clearly, given that a 31-day month only has 744 hours, stochastic sampling will produce a set of iterations, most of which will show no outage event in any particular month. Therefore, even if a 5 percent FOR assumption is input for a particular month, it is not reasonable to expect the results to reflect a 5 percent FOR for the same month.
Additional Reporting
Selecting the Write Frequency Duration Debug Table switch will report an additional FreqDurationStat Output Table with detailed information about the random draws associated with outage events and return-to-service events.
A Final Consideration: Dispatch Hour Settings Do Affect Results
The dispatch hour selection can have a significant impact on the frequency duration method outage modeling results. For the time intervals between dispatch hours, the operating hours accounting assumes the state observed in the prior dispatch hour holds until the next dispatch hour. There is therefore the potential for reporting bias.
